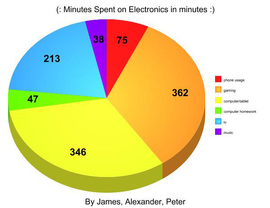
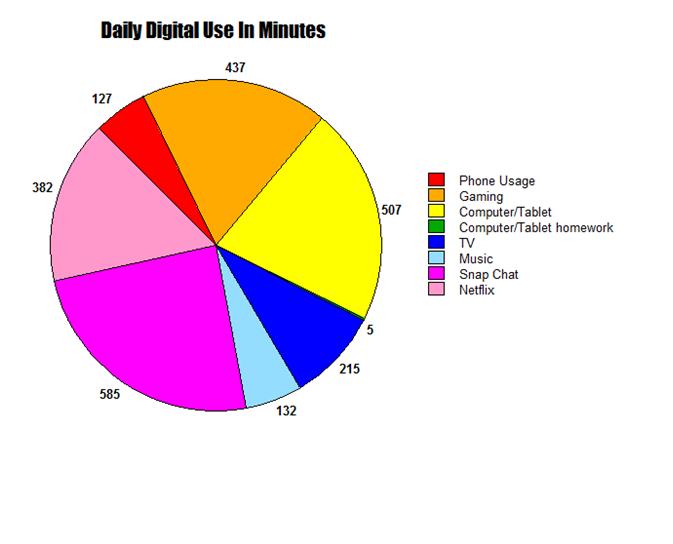
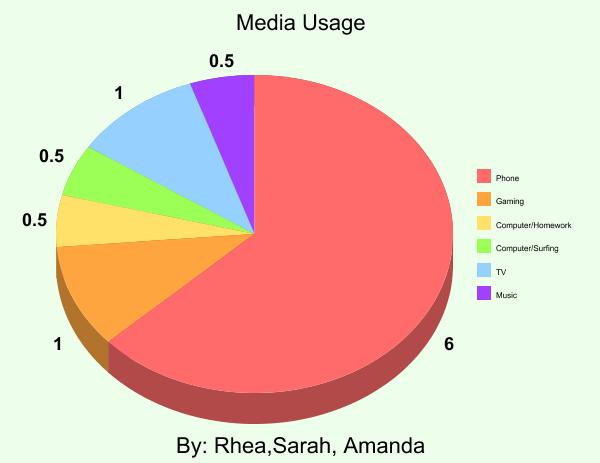
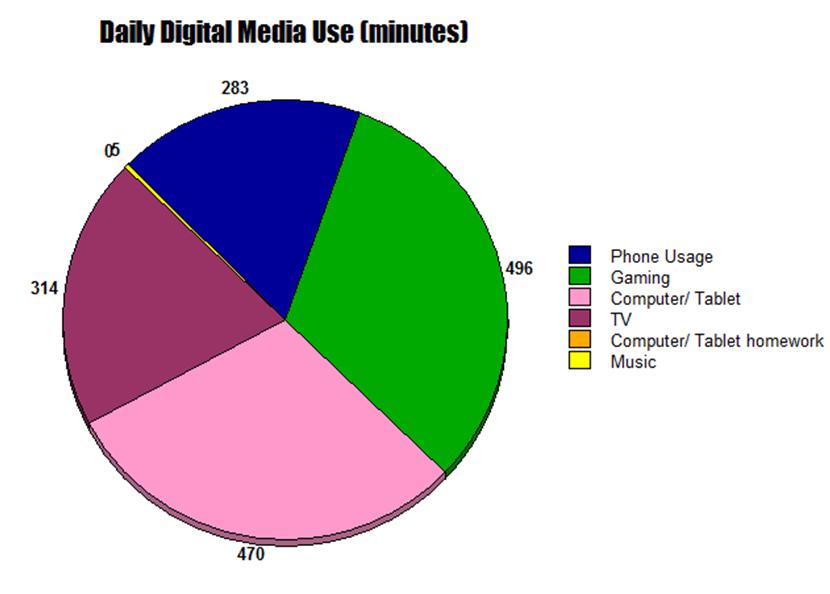
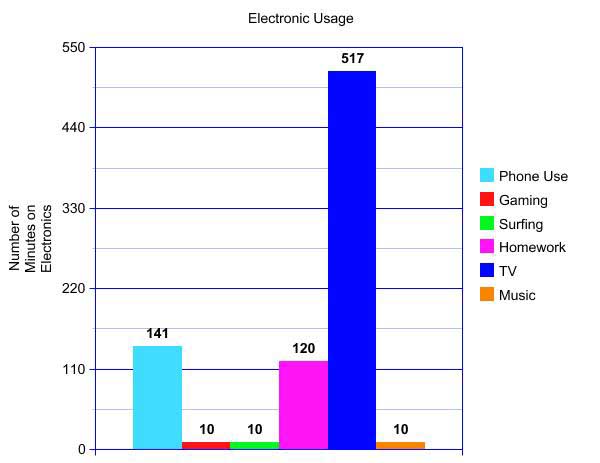
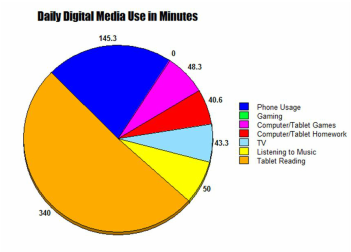
The 7th grade took a look a their digital footprints by keeping track of their time spent on digital media. It was an eye-opener for many! Following individual data collection, students worked in groups of 3 to compile their data. They then used an online tool called Create-A-Graph to publish their results as a group average. Some of the charts are below.
|
|
|
